Description
TL;DR Breakdown Ripple price expected to move downwards after recent rejection The closest support level lies at $0.600 XRP faces resistance at the $0.6250 mark Ripple price was rejected at the $0.6250 mark earlier today, and the price action has continued declining since then. Currently, the price holds above the $0.6000 support level but the … Read more
TL;DR Breakdown
- Ripple price expected to move downwards after recent rejection
- The closest support level lies at $0.600
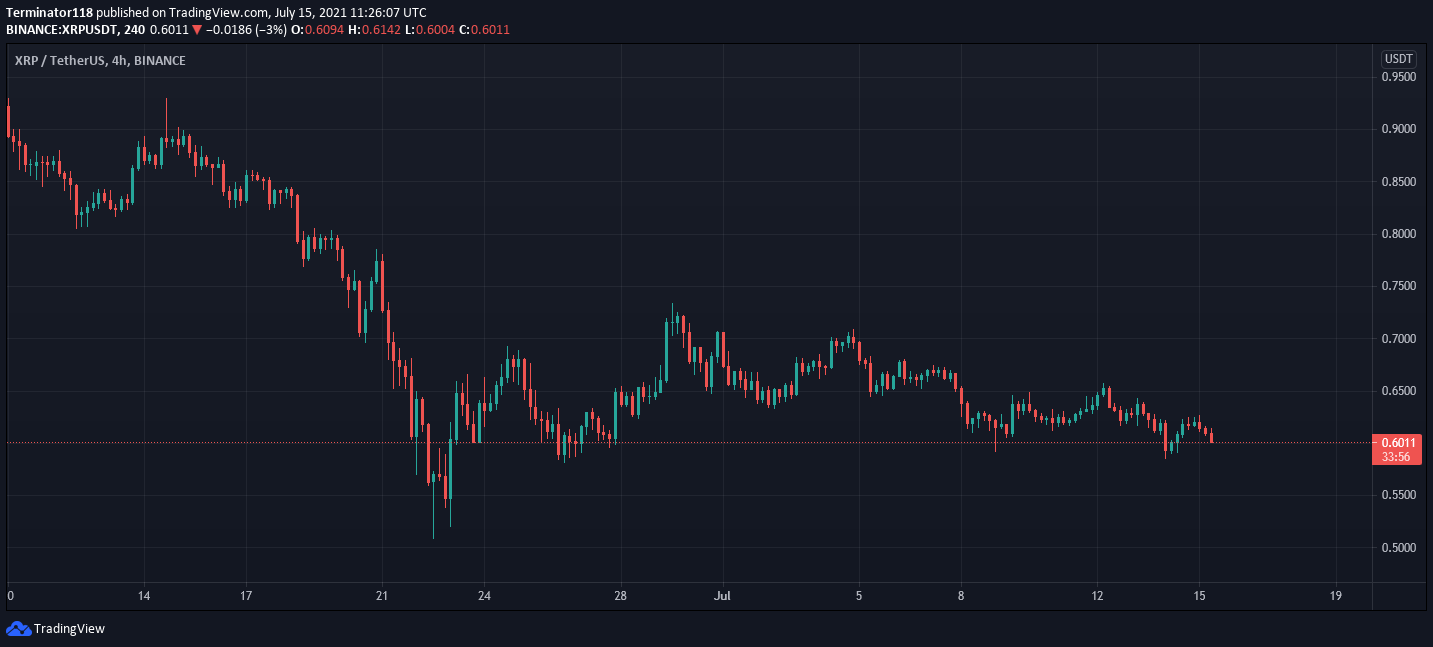
- XRP faces resistance at the $0.6250 mark
Ripple price was rejected at the $0.6250 mark earlier today, and the price action has continued declining since then. Currently, the price holds above the $0.6000 support level but the strong selling pressure suggests further downwards movement.
The broader cryptocurrency market records a net negative sentiment across the last 24 hours as most major cryptocurrencies record losses over the period. These include Bitcoin and Ethereum that record a 2.11 and a 2.61 percent decline respectively.
Technical indicators for XRP/USDT: Bears dominate the markets

Across the technical indicators, the MACD turned bullish yesterday, albeit briefly, as the Ripple price action got rejected from the $0.6200 mark. The indicator quickly exhibited a bearish crossover as the price dropped to the $0.600 mark where it currently hovers. Across the EMAs, the 12-EMA is diverging from the 26-EMA as the selling pressure increases. The 12-EMA is declining with a sharp slope while the 26-EMA moves horizontally.
The RSI is currently neutral and has remain so for a while as the price action showed a steady decline. The neutral position shows low momentum on either side of the market as the trade volume remains low. Currently, the indicator is trading at 40.42, moving downwards as the selling continues. However, there is still room for decline before the indicator issues a buy signal.
The Bollinger Bands are currently wide but show convergence as the price returns to the $0.600 mark. The short-term trend rejection occurred at the indicator’s mean line, which is acting as a resistance for the Ripple price action. Currently, the indicator suggests a drop in the price volatility as XRP continues dwindling.
Overall, the 4-hour technical analysis issues a strong sell signal showing bearish dominance at the current price level. The analysis shows 16 of the 26 major technical indicators in support of a downwards movement for the Ripple price. On the other hand, only one indicator shows some bullish presence at the current level. Meanwhile, the remaining nine indicators sit on the fence and do not issue any signals supporting either side of the market.
The 24-hour technical analysis shares this sentiment also issuing a sell signal showing a negative outlook for the Ripple price action across the mid-term charts. The analysis shows 14 indicators suggesting a further breakdown of the Ripple price against only two indicators suggesting an upward price movement. Meanwhile, ten indicators remain neutral at the time of writing.
What to expect from the Ripple price?
Traders should expect the Ripple price to continue falling as XRP returns to the $0.600 support level. The increasing selling pressure suggests a downwards breakout towards the $0.500 mark. The short-term technical indicators show slight selling pressure, while the mid-term analyses show strong bearish dominance that haunts the asset’s price action.
Conversely, if the buyers defend the $0.600 support level, XRP would recover towards the $0.6200 mark. However, due to the strong selling pressure and the low bullish momentum, further upwards movement is unlikely, and the price action will stagnate at this price level.
[the_ad id=”48512″]