Description
Bitcoin price undergoing consolidation above $11,000 Multiple rejections from $12,000 show bulls are losing buying momentum Solid support at $10,500 to support any violent move downwards Bitcoin price is currently consolidating following a turbulent past week, which saw it violently reject the $12,000 mark. Bulls are firmly in the driving seat, and they are in … Read more
- Bitcoin price undergoing consolidation above $11,000
- Multiple rejections from $12,000 show bulls are losing buying momentum
- Solid support at $10,500 to support any violent move downwards
Bitcoin price is currently consolidating following a turbulent past week, which saw it violently reject the $12,000 mark. Bulls are firmly in the driving seat, and they are in no mood to concede the ground to the bears. However, bulls have to bring a strong buying uptrend to start the next leg of rally upwards.
Bitcoin price is hovering around the lower $11,000 levels after briefly pushing over the $12,000 mark. On Tuesday, bulls tried to take the BTC/USD pair towards $11,500 resistance, but the price again retreated towards the $11,000 support area. On the positive side, there’s solid support in this region ready to provide a firm landing to any further jump upwards.
Slowing momentum draws bearish signals on the chart
The struggle between bulls and bears is leading to sideways movement on the hourly chart. The stagnant movement is also creating a limited price action. In case it is rejected a few more times from the crucial resistance at $12,000, the bulls may run out of breath.
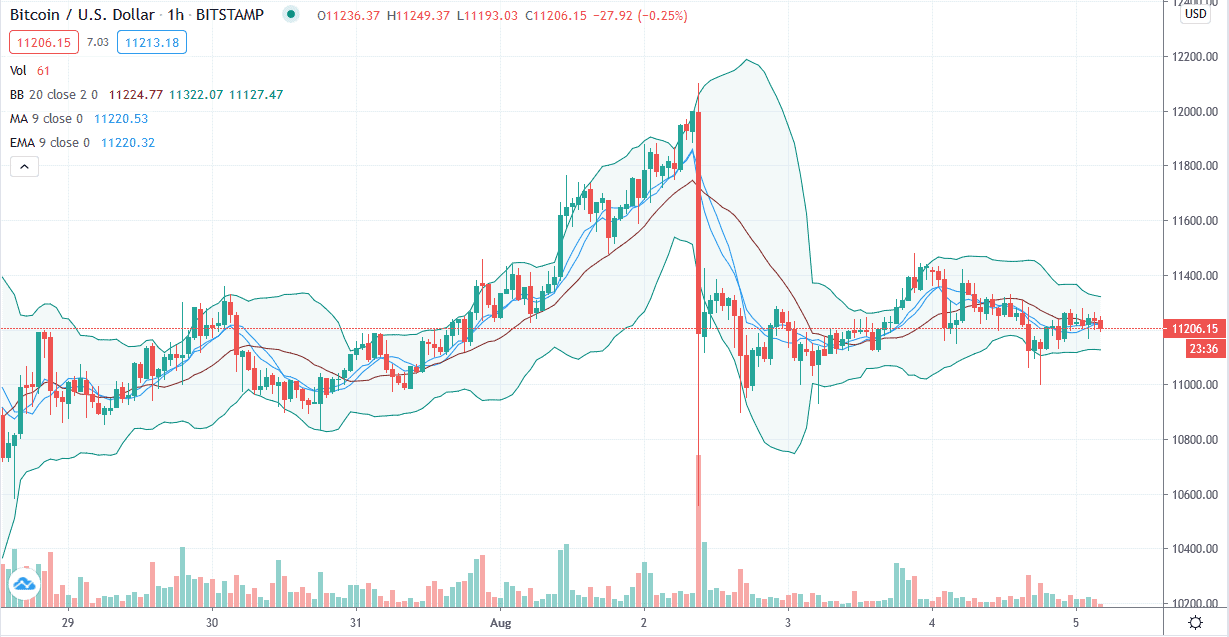
Bitcoin price chart by TradingView
The recent price movement has created a ‘head and shoulders’ pattern on the hourly chart that is a bearish omen. If proven right, it may mean a massive move downwards. Bulls will have to counter it with some substantial buying activity. However, the Fibonacci study still shows that Bitcoin price has the potential to touch $13,000 level in the next few days.
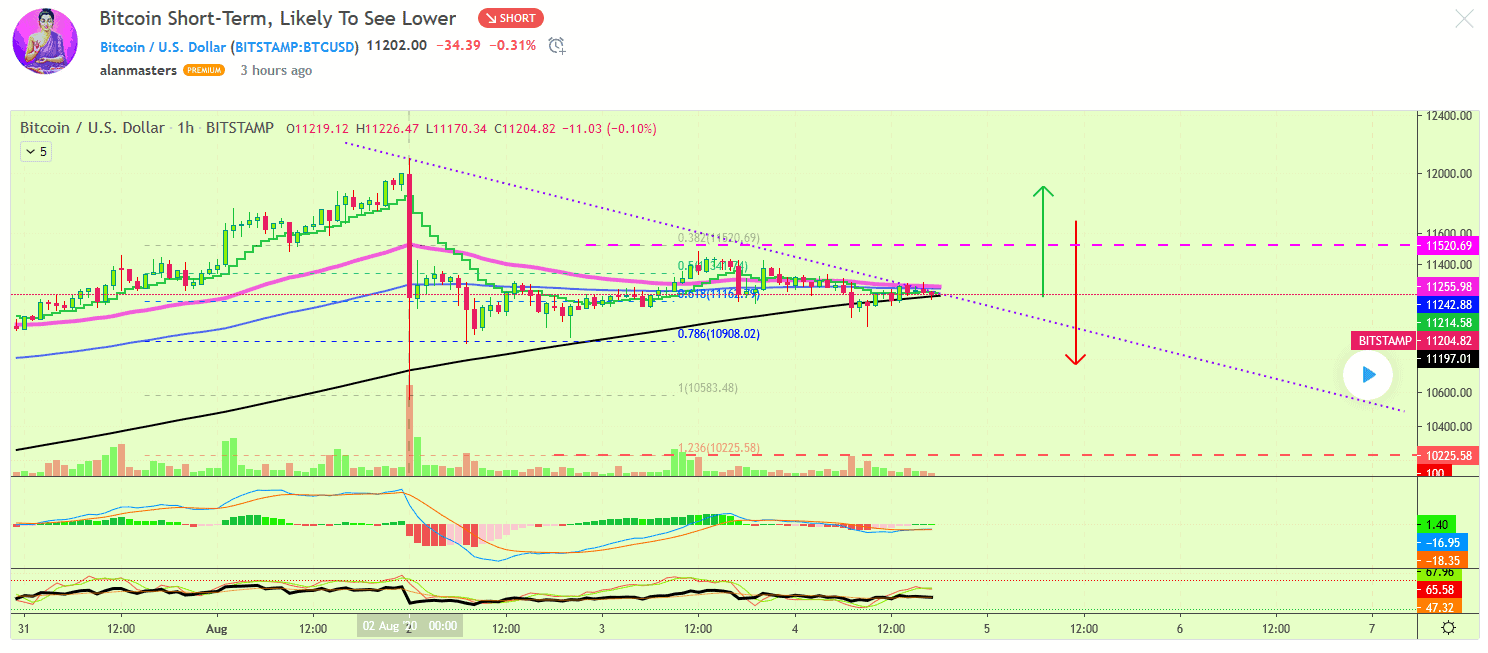
Bitcoin price chart by TradingView
The stagnation is the price is shown by Alan Masters in the chart above. The series of rejections on the hourly chart shows that bears may soon take charge. Subsequent attempts to breach the $12,000 resistance has resulted in selling and profit booking. The rising Bitcoin futures interest may not provide much support to the actual price action in the BTC/USD pair.
What will it take to touch $13,000
The next leg of the rally in Bitcoin price may very well come from altcoins. As the altcoin fever reaches the FOMO stage, traditional investors would increase their positions as well. However, they are likely to follow a safer route instead of the volatile altcoins, which means that Bitcoin would emerge as a probable choice.
Also, Bitcoin price would have to break the bearish ‘head-and-shoulders’ pattern in a decisive manner to climb higher. At the same time, the $10,500 level or 0.786 Fibonacci level must remain safe at all times. A move below this basic level may exponentially increase selling pressure pushing the price downwards.
Disclaimer: The information provided is not trading advice but an informative analysis of the price movement. Cryptopolitan.com holds no liability towards any investments based on the information provided on this page.